



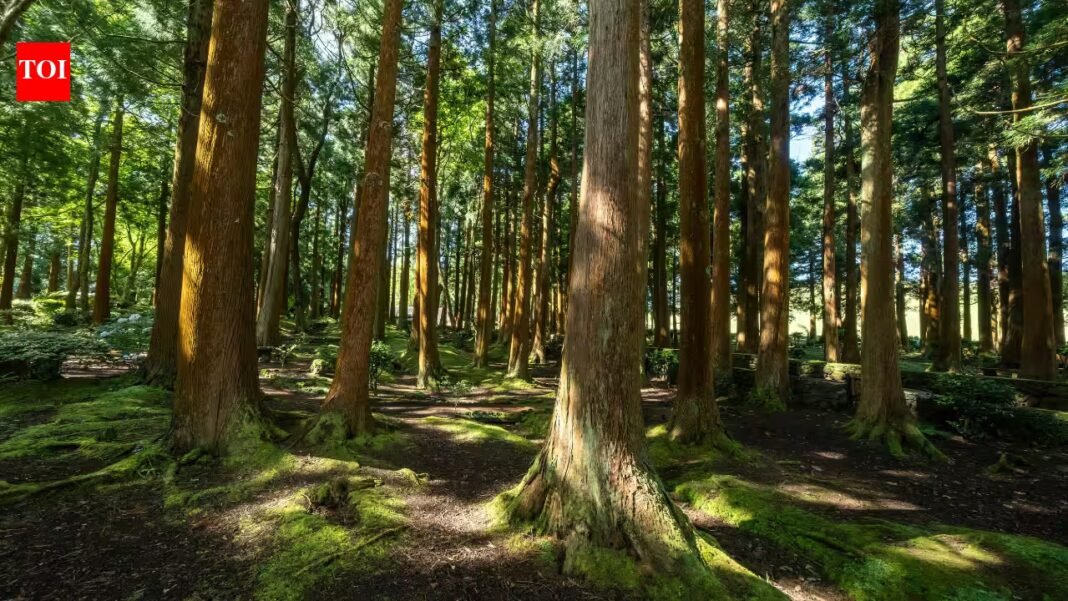
United States deforestation has permanently removed nearly 10 million acres of forest between 1990 and 2017, according to new research on land conversion and forest loss across the country. Woodland cleared for development and cropland disappeared at a pace of as many as 350,000 acres every year, roughly one football field every two minutes, year after year for 28 years. The researchers behind the analysis describe the national scale of permanent forest loss as both significant and increasing, a finding with direct and far-reaching consequences for land conservation, for climate change impacts and for the carbon stored in American trees.
How the Forest Monitor separates lasting forest loss from timber harvests and wildfire damage
The United States Forest Monitor, built by researchers at Clark University for the Open Space Institute, concentrates on clearing that lasts. According to the Clark University report, it uses annual land cover records from the United States Geological Survey and picks out ground that was forest, became non-forest and stayed that way for at least five years. That conservative filter avoids year-to-year swings in classification. Only conversion to development or cropland is kept, because those uses typically persist for decades, while pasture, shrub, scrub and barren land are excluded since they often revert to forest. The system works at a resolution of 30 metres, roughly one-quarter of an acre per pixel.
Development and cropland drive the loss, and the rate is rising again after the Great Recession
The two drivers leave very different footprints. Development-driven loss clusters around urban centres and expanding metropolitan and suburban regions, making it easy to spot on a map. Cropland expansion accounts for roughly half of all forest loss nationwide, yet it is spread more thinly across the landscape, so its signature is far less visible. Development-driven loss declined after the Great Recession of 2008, but the researchers point to growing evidence that rates of loss have begun to increase again. They also focus on gross conversion rather than net change, because mature forests generally provide greater ecological and climate benefits than younger ones, and many other monitoring approaches count harvests and wildfires that are often followed by recovery.
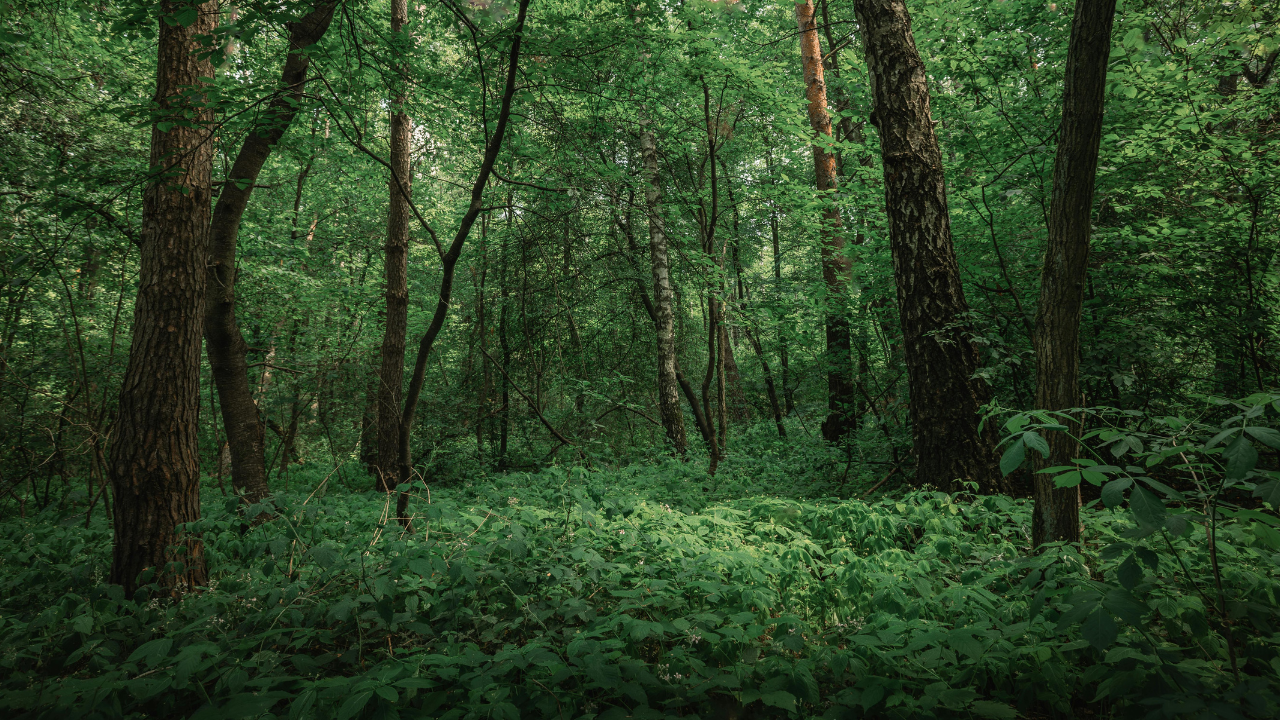
Image: Canva
Hotspots reveal 61 areas of concentrated forest loss, and past clearing points to future losses
The analysis identified 46 development-driven hotspots and 15 cropland-driven hotspots, the places where losses are packed most tightly together. Example maps show intensive conversion for development around Raleigh and Richmond, and cropland expansion in areas spanning Alabama and Georgia, North Carolina and South Carolina, and Mississippi. Recent conversion often sits close to development and cropland that existed before 1990, which makes past forest loss a good indicator of future loss. Loss outside the hotspots can matter too, particularly where it affects large intact forested areas, and the researchers flag that as a subject for further inquiry.
Southern states carry the heaviest burden, with six states responsible for half of all forest loss
Half of all conversion occurred in just six states: Georgia, Texas, North Carolina, Florida, Arkansas and Alabama. Adding Virginia, Mississippi, Missouri, South Carolina and Tennessee takes the total to 11 states, and approximately 70 per cent of national loss, and all of the top 13 states are in the southeastern or south central regions. The 10 states with the greatest area lost account for 67 per cent of the national total. Six of the top 20 sit outside the region: Washington, Pennsylvania, Ohio, Michigan, New York and Minnesota. Loss rates reach as high as 42,000 acres per year, the equivalent of clearing an area the size of the District of Columbia annually.
Measured by share of forest lost, Georgia passes four per cent and Virginia counties lose the most
Measured against the forest each state had in 1990, the same southern states dominate, joined by some northeastern surprises. Georgia, North Carolina, Florida, South Carolina, Texas, Arkansas and Virginia appear among the 10 states with the largest percentage of forestland permanently converted, alongside Delaware, New Jersey and Massachusetts. Each lost 2.7 per cent or more of its 1990 forestland, and Georgia lost 4 per cent. Some counties lost as much as 40 per cent of their initial forest within a few decades, nearly all of them in the southeast, with a few in the Pacific Northwest, and almost all close to rapidly expanding urban centres. The three hardest-hit counties are all in Virginia.
The climate toll: 2.3 billion metric tons of carbon dioxide equivalent committed to the atmosphere
Gross loss amounted to roughly 2 per cent of the nation’s forestland, and the Clark University report reaches its climate figure by counting both direct carbon emissions and the loss of expected future carbon storage. About 65 per cent of the total comes from direct emissions and roughly 35 per cent from foregone sequestration. Albedo change, the extra sunlight reflected back into space once forest becomes developed land or cropland, partly offsets the damage, reducing the total by about 15 per cent. Annual deforestation equals approximately 8 per cent of the carbon absorbed each year by remaining forests, 29 per cent of emissions from harvested wood products and roughly 1 per cent of fossil fuel emissions across all sectors in the 2020s.
Six states cause half the climate burden, and Washington ranks higher for carbon than for acres
Rankings change when the measure is climate impact rather than acreage, because forest carbon stocks, storage potential and albedo change differ from place to place. Half of the burden comes from Georgia, North Carolina, Texas, Florida, Virginia and Alabama. Adding South Carolina, Arkansas, Mississippi and Washington brings the share to 70 per cent. Washington ranks 14th for the amount of forest lost but 10th for carbon burden, thanks to the high carbon storage of its western forests.
What the report leaves out, and how the next version aims to close the gaps through 2024
The researchers are open about what the first version misses. Its cautious approach omits some conversions, including forest turned to pasture, which is often confused with shrubland, savanna and areas of partial tree cover loss. The five-year persistence test also delays reporting, and no formal accuracy assessment has been carried out because it is not currently funded. Over the coming year the team plans to extend tracking to 2024, and it is exploring an early warning system that flags probable recent conversion. State-level reports, with Pennsylvania as the worked example, are in development, and the findings are aimed at land trusts, state climate strategies and carbon offset markets seeking to prioritise forest protection.